Data Analysis with Python
Learn how a price of a house is related to its relative location and how data uncovers the deepest co-relations that we didn't know existed.
 22456 Learners
About This Course
Discover new aspects of data wrangling, analysing and various aspects of data visualisation. This programme will take you through the basics of data manipulation with python to machine learning models and prediction analysis of data. This programme is delivered through Hands-on labs and assignments.
Concepts covered in Python with Data Science
 Basics of Python
 Numpy
Numpy
 SciPy
SciPy
 Advanced concepts in Python
 Multidimensional arrays
 Sikit-Learn
 Pandas
 Data Frames
 Add on topics
Projects Titles

House Price Prediction
Predict the house prices around the block.

Titanic Dataset prediction
Predict how many people will survive in titanic today
Pricing Plans
Mentor Lead
₹ 10,000
Certificates
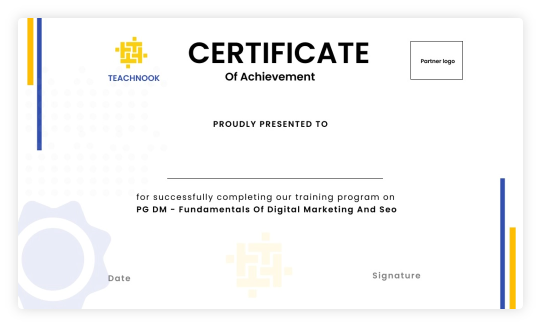
Get certified by pioneers of Ed-tech industry by upskilling in modern technology

Frequently Asked Questions
What is the duration of the IBM program?
The duration of the IBM program is two months.
Will I still be having access to the content of the course?
Overall you will be having six months of access to the course the date of enrollment
Is there any examination to get IBM certificate?
Yes! There is an examination to get an IBM certificate.
When will I receive the certificate?
You will receive the certificate two or three weeks later from the day of submitting your final projects.
What our students says about IBM Courses

Pratyush Panda
Web Development
The explanation along with the demonstration is very helpful and easy to understand.

Shivaprasad M
Car Designing
Learnt so many things about my course. And overall it was a nice experience.

Rehan Imtiaz
Data Science
I overall had a very great experience with technook. It was amazing to learn from it

Dushyant
Digital Marketing
The teacher is highly experienced according to the current scenario. He clears the topic well.
Explore Our other Courses
Python with data science
Deep dive into the patterns and statistics using the advanced data analysis tools in python. Learn the language in which data communicates its crucial insights
Data Visualization with R
Explore the beautiful fields of statistical visualisation and graphical representations with R. Learn to see the data across a timeline like never seen before.
Deep learning with Tensor Flow
Understand and uncover how a tesla analyses all the objects in front of it and how it is able to navigate obstacles in real time using pre-trained deep learning models.
Data Analysis with Python
Learn how a price of a house is related to its relative location and how data uncovers the deepest co-relations that we didn't know existed.
Internet of Things
Want to learn how your car/fridge connects with the internet and personalise your experience for your household devices using sensors and actuators.
